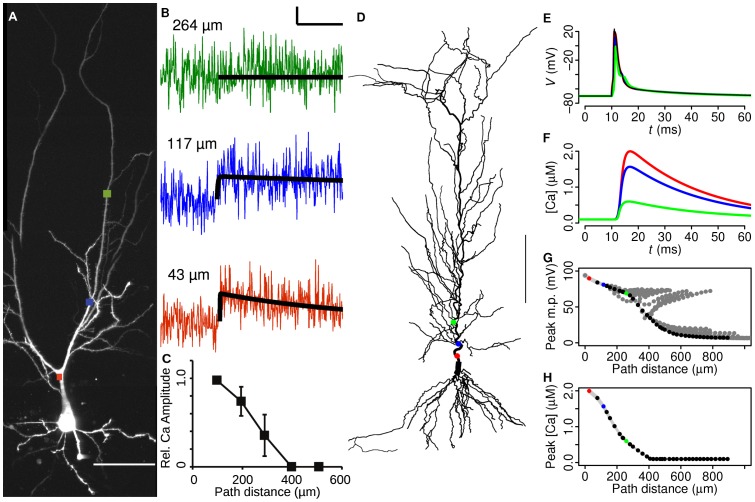
Figure 1. Peak calcium induced by somatic BAP decays with distance in both experiments and model simulation.
A, Two-photon compressed z-stack morphology of CA1 pyramidal neuron. Squares indicate line-scan measurement sites (scale bar 50 µm). B, Corresponding single BAP-induced fluorescence changes in the apical shaft. A double exponential is fitted to the fluorescence traces as described in Materials and Methods. Distances between the point measured and the soma are indicated, determined by tracing the fluorescence of Alexa 594 in 3D from the scanned region back to the soma. C, Peak calcium-induced fluorescence plotted against distance to soma. Mean ± S.E.M. shown. Multiple points are measured per cell. Fluorescence amplitude is plotted relative to the first measured data point at circa 100 µm, to show the distance-dependent decrease of amplitude corrected for the large amplitude variation between cells. D, CA1 pyramidal neuron morphology of the model (scale bar 100 µm). Circles indicate locations of recordings and points with corresponding colour in E–H similar to the experimental paradigm (A–C). E, F, Peak voltage and peak calcium levels in the apical shaft following a somatically-initiated BAP. G, H, Peak voltage and calcium levels versus distance from soma for all apical dendritic shaft locations. Note that distance to soma is measured in 3D along the dendrites, while panel D shows a 3D-compressed image.

