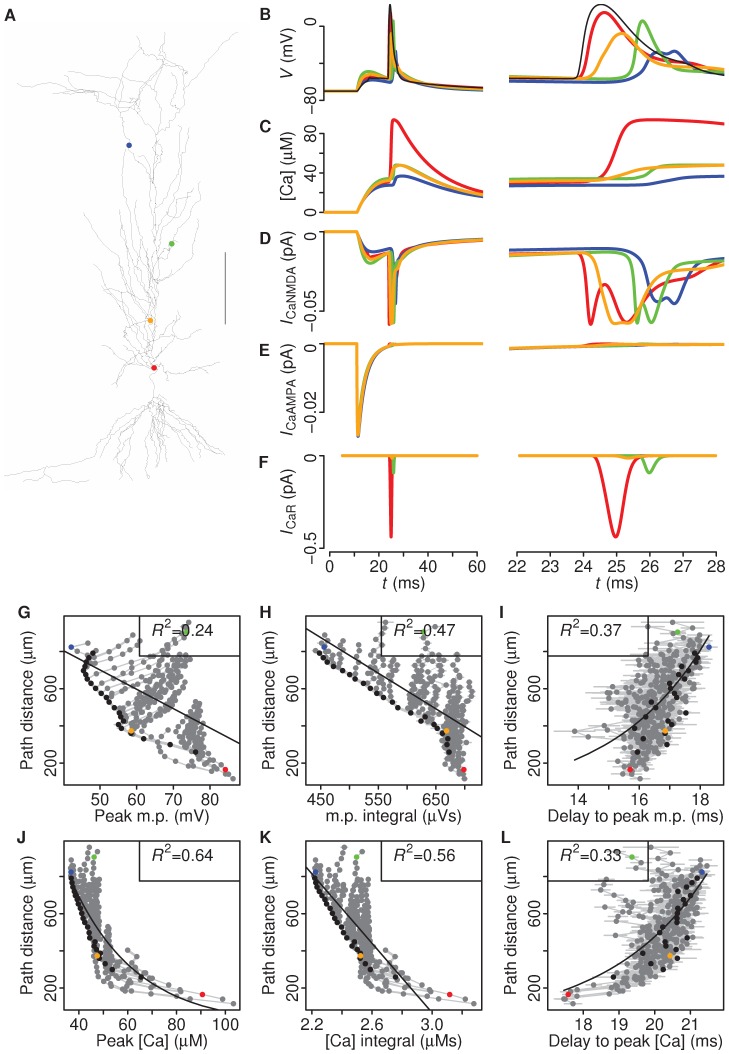
Figure 2. Synaptic induction of BAP displays distance-dependent voltage and calcium changes across the dendritic tree.
A, CA1 model neuron. Circles indicate spine head locations of example measurements highlighted in B–L. B–F, Measurements from the spine heads indicated by the corresponding colours in panel A, indicating membrane potential (B), calcium concentration (C), NMDA-mediated currents (D), AMPA-mediated currents (E) and R-type currents (F). The right-hand plots show the same data, but magnified around the time of the arrival of the BAP at the spines. G–L, Peak, integral and delay-to-peak voltage and calcium measurements are plotted as predictors for path distance. Black circles indicate apical shaft spines. R 2 values are shown.

