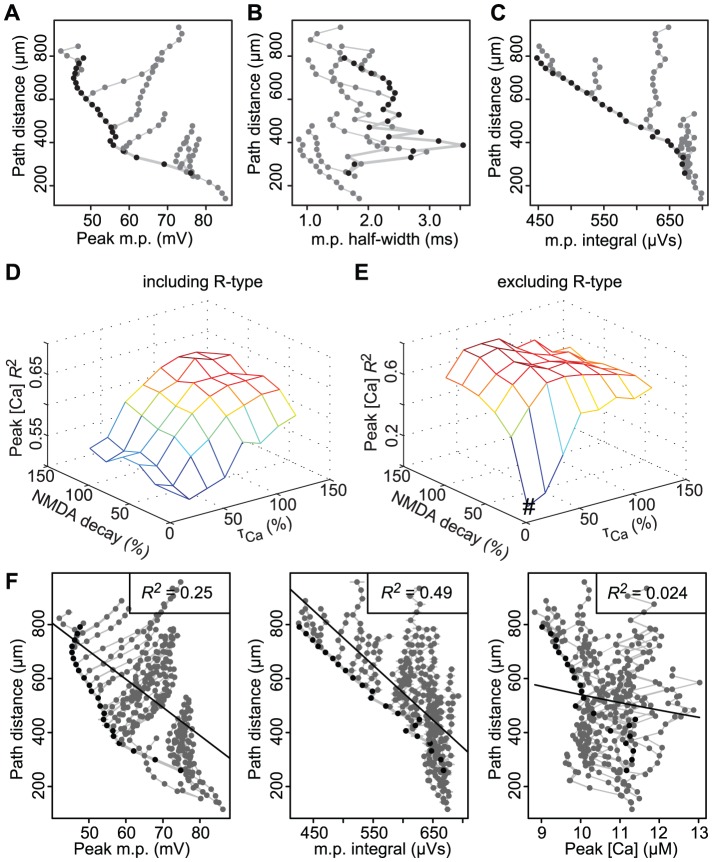
Figure 5. The contribution of calcium conductance and dynamics to distance-dependent correlations.
A, Relationship between peak voltage and soma-spine distance in a sample of branches in the CA1 model neuron. B, Relationship between voltage half-width and distance to the soma for same sample of branches shown in A. C, Relationship between voltage integral and distance to the soma for same sample of branches shown in A. D, E, R 2 values for combinations of NMDA decay and calcium extrusion time constants for all spines, with and without R-type channels. # indicates an 80% decrease in NMDA decay and in calcium extrusion time constants that are used in all other figures in the manuscript. F, For 80% decrease in values (indicated # in E), relationship between soma-spine distance with peak voltage (left panel), voltage integral (centre panel) and peak calcium in spines (right panel). Correlations for peak voltage and voltage integral remain stable (compared with Fig. 2G, H) but the correlation with peak calcium concentration disappears (comparison with Fig. 2J).

