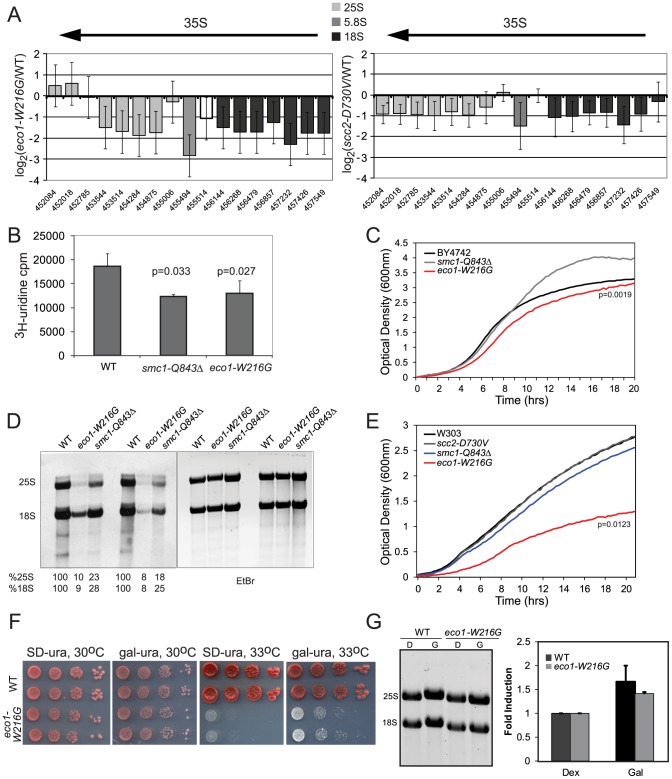
Figure 5. Cohesin mutations compromise production of ribosomal RNA.
A. The ratios for microarray probes corresponding to the 25S, 5.8S and 18S transcripts of the rDNA locus are shown for eco1-W216G/WT and scc2-D730V/WT at time 0 from Figure 1. The x axis corresponds to SGD coordinates, ordered by the beginning of the probe with the midpoint of the probe given. The arrow indicates the direction of transcription. The error bars show the standard error. B. Strains were in log phase in SD-ura at 30°C when an aliquot was removed and 3H-uridine was added for 5 min to equal numbers of cells for each strain background. Incorporation was measured by scintillation counting after extensive washing of the cells. Three independent cultures were labeled to derive the standard deviation. Significance was calculated using an unpaired t test. C. A growth curve is shown for the strains in SD-ura medium at 30°C. A similar experiment was performed in the W303a background and is included in Figure S4. D. Strains were grown in SD-met at 30°C and RNA was extracted from equal numbers of cells following a 5 minute pulse with 3H-methylmethionine and a chase with cold methionine. Equal amounts of RNA were run on a formaldehyde gel and photographed following staining with ethidium bromide (EtBr). Then the RNA was transferred to a membrane for exposure. Following exposure, the bands were excised and radioactivity was determined by scintillation counting. Percent incorporation is given as a fraction of WT. Independent biological replicates are shown. E. A growth curve is shown for the strains in SD-met medium at 30°C. F. Growth of the eco1-W216G mutant at 33°C is partially rescued by expression of the rDNA from a Pol II (gal) promoter. G. Total RNA was isolated from the strains shown following growth in raffinose followed by a 5.5. hour incubation with either glucose or galactose. The total amount of 28S+18S was quantified in glucose and galactose.

