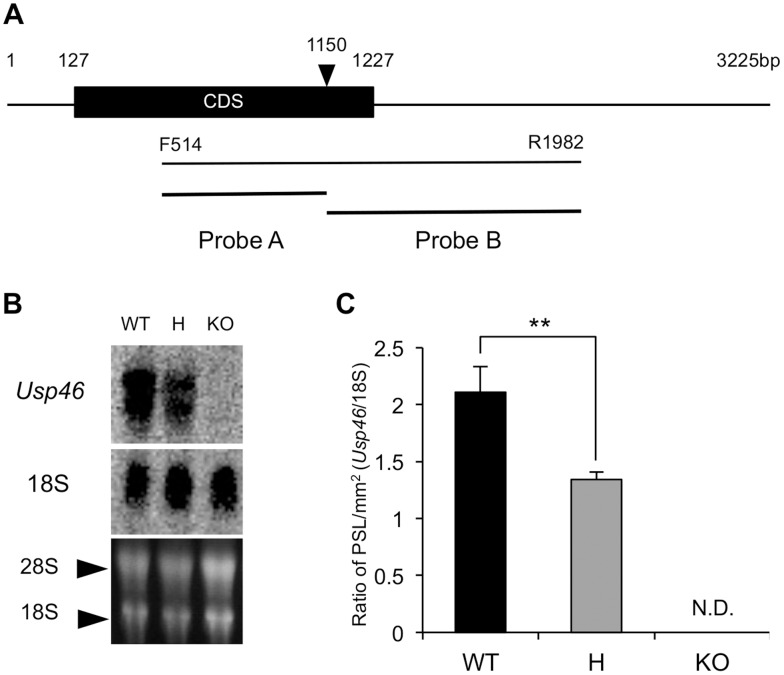
Figure 2. Expression of Usp46 mRNA in the brain analyzed by northern blot analysis.
(A) Schematic diagram of cDNA and probes for Usp46. Probes A and B were used for the northern blot analysis. Black arrowhead indicates the EcoR1 site. F514 and R1982 are a primer pair for PCR. (B) Northern blot from brain total RNA hybridized with the mouse Usp46 cDNA probes A and B, labeled with [α-32P] dCTP. The blot was hybridized with a cDNA probe for S18 as an internal control (the middle panel). The bottom panel shows a photograph of an RNA gel, indicating that equivalent amounts of total RNA were used in each lane. (C) Relative values of Usp46 mRNA. PSL (Photo stimulated luminescence) was measured. Signals from the Usp46 KO mice (KO) were not detected (N.D.). The differences between the wild-type mice (WT) and the heterozygotic mice (H) were significant (**P<0.01, n = 6, Student’s t-test).

