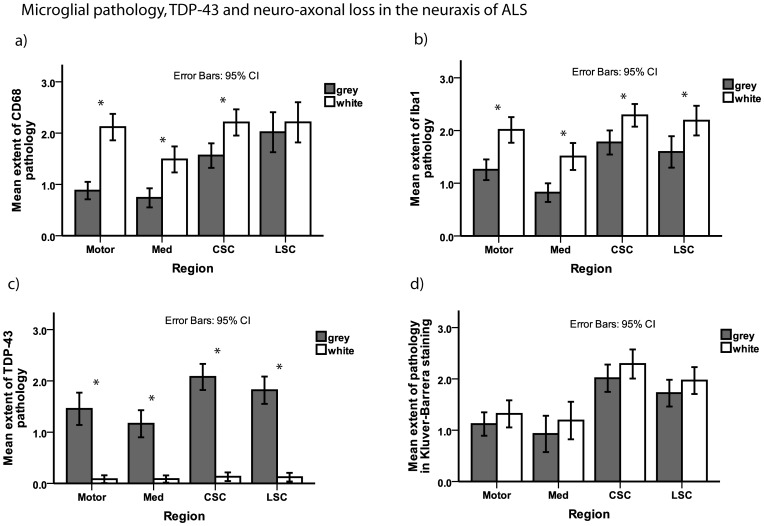
Figure 2. Microglial pathology, TDP-43, and neuro-axonal loss in the neuraxis of ALS.
Bar plots show extent of microglial pathology as detected by staining for CD68 (a) and Iba1 (b) as well as TDP-43 pathology (c) and myelin loss as an indirect measure of axonal loss (d) in different regions of the neuraxis of ALS. For the spinal cord sections, the grey matter examined was the anterior horn and the white matter examined was the anterior and lateral portion of the CST. Whiskers in bar plot indicate 95% confidence interval of mean. CSC = cervical spinal cord, grey = grey matter, LSC = lumbar spinal cord, Med = medulla oblongata, motor = motor cortex (gyrus praecentralis), white = white matter.

