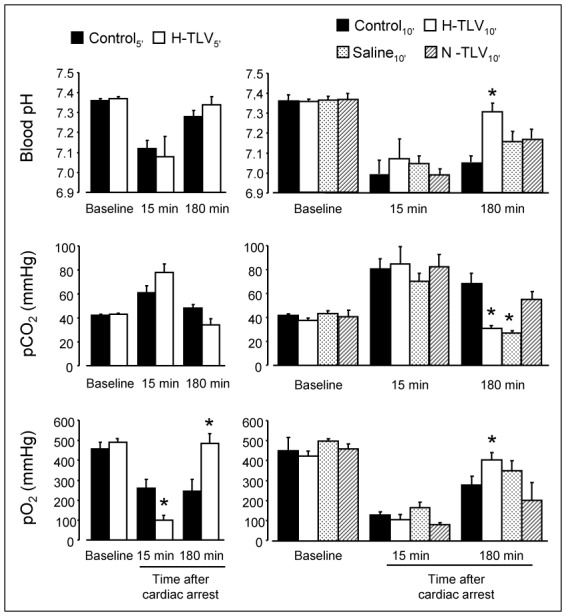
Figure 5. Blood pH, pCO2 and pO2 in the different experimental groups.

* p<0.05 vs corresponding control; n=10 in each experimental group; TLV, total liquid ventilation; H-TLV, hypothermic TLV; N-TLV, normothermic TLV; Saline, hypothermia induced by intravenous administration of cold saline combined to external cooling.
