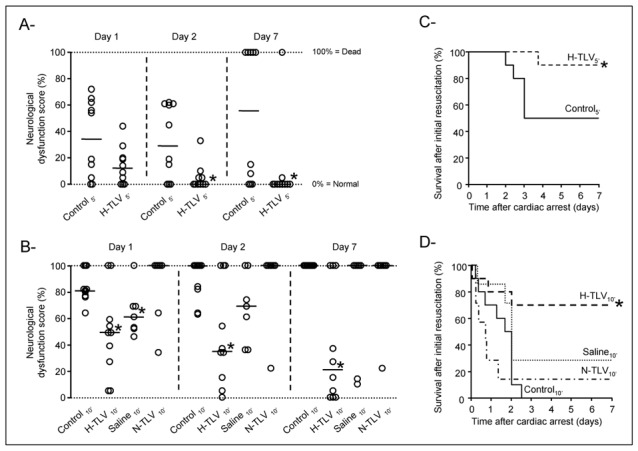
Figure 6.

Panels A and B: Neurological dysfunction scores at days 1, 2 and 7 following resuscitation in the different experimental groups submitted to 5 min or 10 min of cardiac arrest, respectively. Open circles represent individual scores and the thick line represents the median value of the corresponding group. Only animals achieving resumption of spontaneous circulation were included.
Panels C and D: Kaplan-Meyer survival curves in the different experimental groups submitted to 5 min or 10 min of cardiac arrest, respectively. Only animals achieving resumption of spontaneous circulation were included.
* p<0.05 vs corresponding control; TLV, total liquid ventilation; H-TLV, hypothermic TLV; N-TLV, normothermic TLV; Saline, hypothermia induced by intravenous administration of cold saline combined to external cooling.
