
Figure 6.
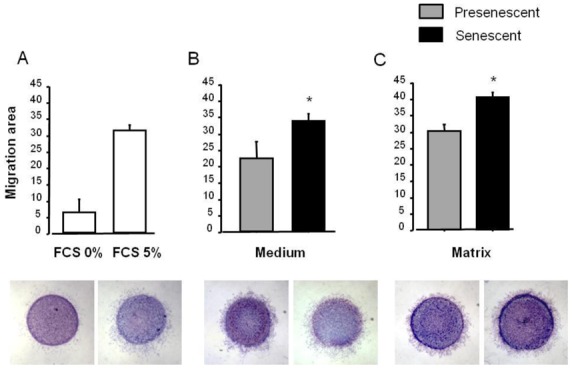
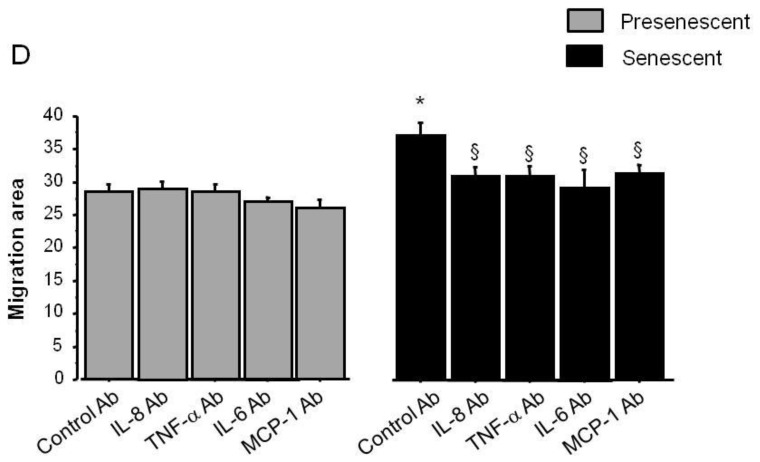
Stimulation of migration of normal PA-SMCs by soluble (medium) or insoluble (matrix) factors secreted by presenescent (gray bars) or senescent (black bars) PA-SMCs. Presenescent cells were passage 3–4 cells from controls and senescent cells were passage 3–4 cells from patients with COPD. (A) Migration area of cells measured 24 h after stimulation by 0% or 5% fetal calf serum. (B) Migration area of cells after exposure to the medium of presenescent or senescent PA-SMCs. (C) Migration area of cells onto matrices deposited by presenescent or senescent PA-SMCs. Values are mean±SEM of six values obtained from three independent experiments. Photomicrographs represent corresponding cells migrating from agarose droplets. (D) Migration area of cells after exposure to the medium of presenescent or senescent PA-SMCs in the presence of control or neutralizing antibodies to IL-8, TNF-α, IL-6, and MCP-1. *P<0.05, versus values corresponding to stimulation by presenescent cells; § P<0.05 versus values with control antibodies.