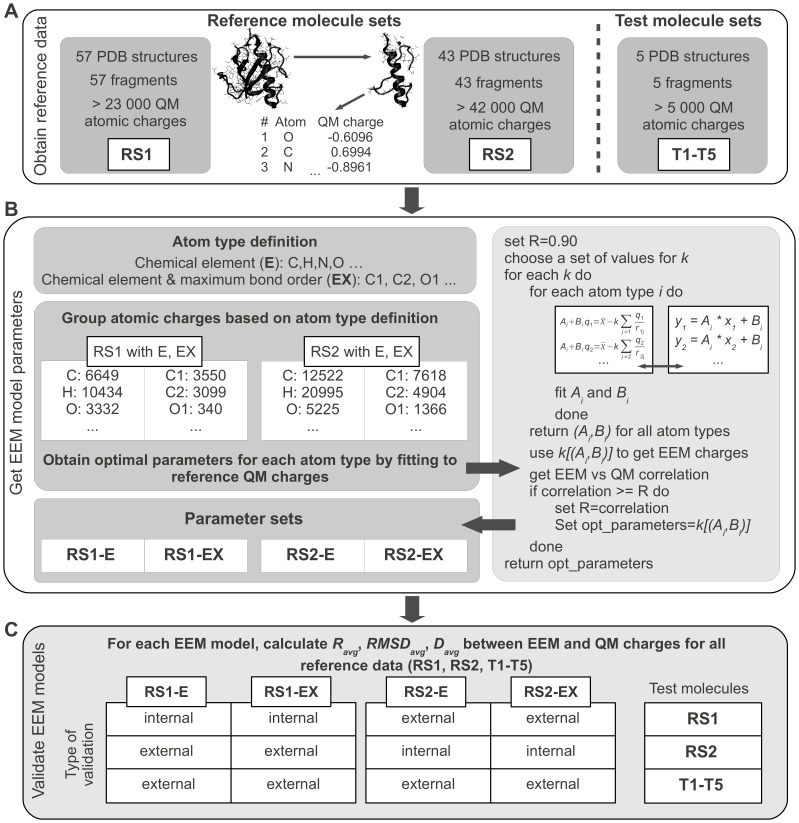
Figure 2. Flowchart of calibration of an EEM model for calculating partial atomic charges in proteins.
(A) The reference data used in this study consisted of QM atomic charges for protein fragments in two reference sets (RS1, RS2) and one test set (T1–T5). (B) Two atom type definitions were used. The atomic electronegativity equations were grouped together based on the atom type. The EEM model parameters for each atom type were then obtained by least squares fitting to reference QM charges. (C) Each EEM model was subjected to internal and external validation by comparing the EEM charges with reference QM charges for all available data sets (RS1, RS2, T1–T5).

