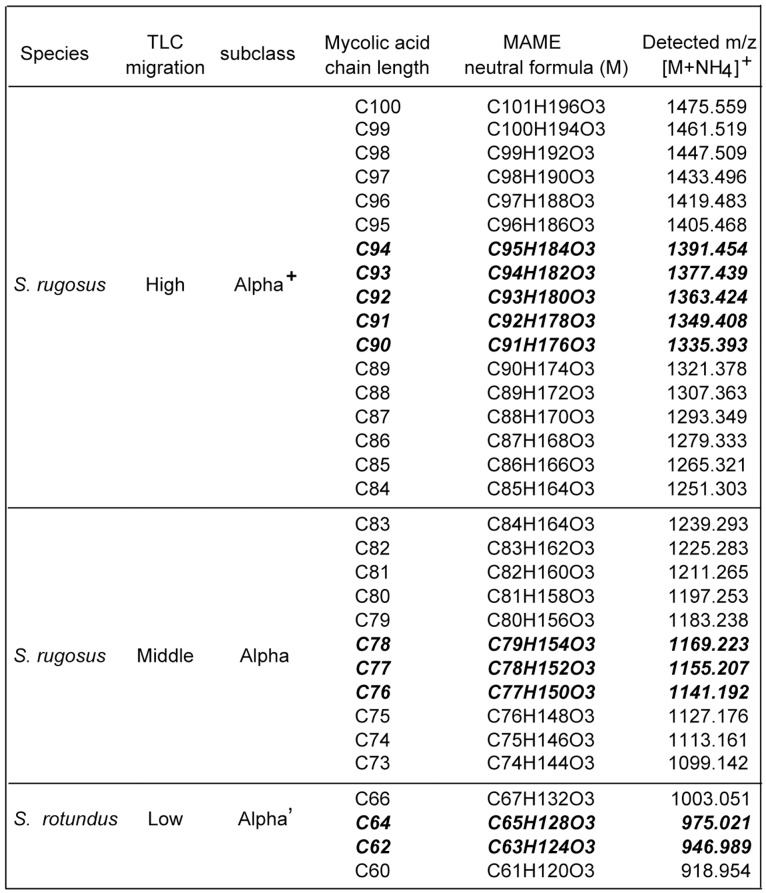
Figure 3. α+, α, and α’ mycolates.
Positive-ion mode Q-Tof mass spectrometry of 1D TLC purified MAMEs derived from S. rugosus (high and middle bands) or S. rotundus (low band). The high migrating MAMEs with longer chain length, the middle migrating MAMEs with medium chain length, or the low migration MAMEs with shorter chain length were initially designated as α+, α, or α’ mycolate subclasses, respectively. The most intense molecular ions, observed here as ammonium adducts, present in each subclass are indicated in bold and italics.

