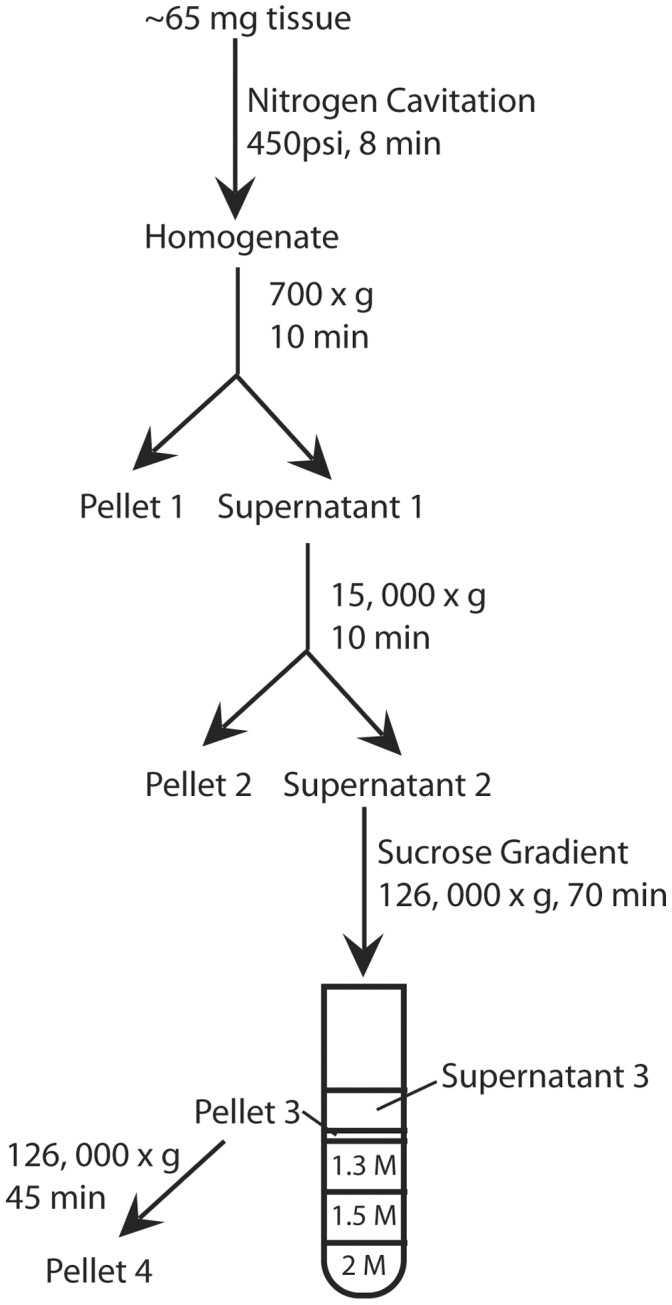
Figure 1. Flow chart of endoplasmic reticulum isolation.

Nitrogen cavitation of tissue was followed by a series of centrifugation steps and sucrose density gradient centrifugation.

Nitrogen cavitation of tissue was followed by a series of centrifugation steps and sucrose density gradient centrifugation.