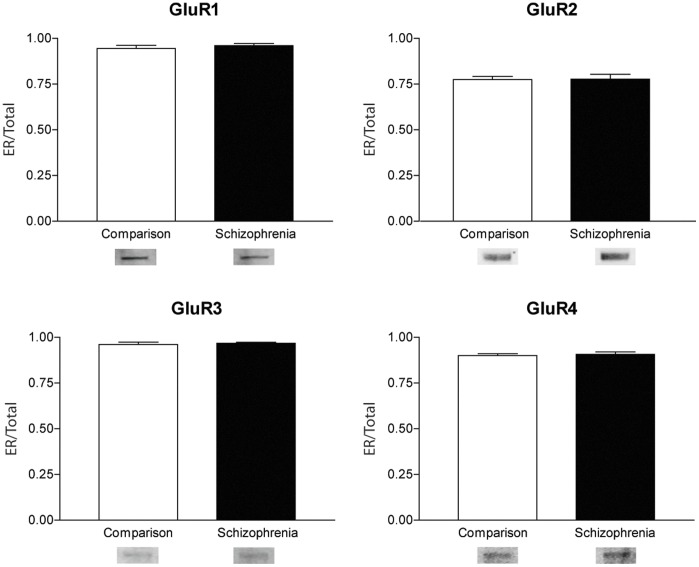
Figure 4. Western blot analysis of AMPA Receptor subunit expression in enriched endoplasmic reticulum fraction (A – GluR1, B – GluR2, C – GluR3, D – GluR4) normalized to relative expression in total homogenate.
Representative blots of ER fraction. Error bars represent standard deviation. GluR1: F(1,30) = 0.57558, p = 0.45. GluR2: F(1,30) = 0.00725, p = 0.93. GluR3: F(1,30) = 0.28370, p = 0.59. GluR4: F(1,32) = 0.15205, p = 0.69.

