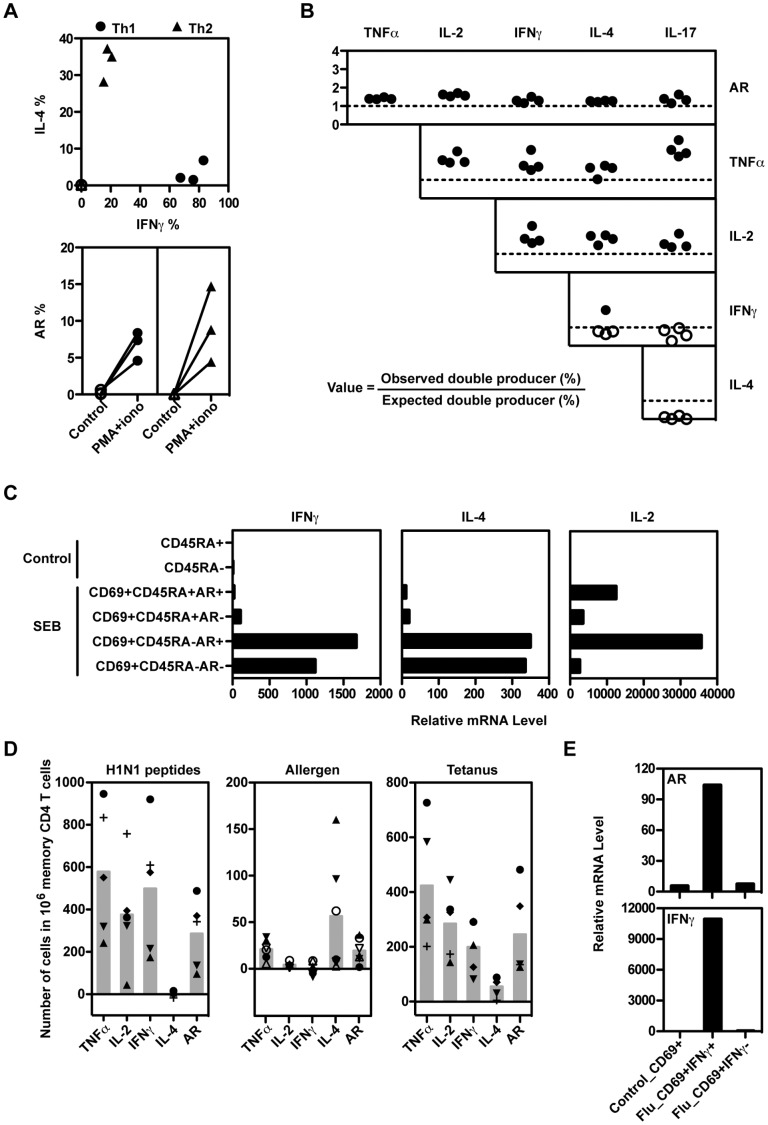
Figure 5. Several human CD4 T cell subsets can produce AR.
(A) Allogeneic Th1 and Th2 cell lines from three subjects were stimulated with PMA + ionomycin for 6 hours. The percentage of cells expressing IFNγ, IL-4, and AR was analyzed by ICS. (B) The expression of AR and other cytokines was measured in SEB-stimulated PBMC from four subjects by ICS, calculating the frequencies of single cytokine producers, and all possible combinations of double-producers, among the CD154+ CD4+ T cells. The figure shows the ratio between the observed frequencies of double-producing T cells for each cytokine pair, and the expected frequencies (calculated as the product of the individual frequencies for each cytokine). Values represent the ratios for the double-producer combination defined by the row and column labels. Ratios above or below 1 are indicated by solid or open symbols, respectively. (C) IL-4, IFNγ and IL-2 mRNA levels were measured by RT-PCR in the sorted populations described in Figure 4C. (D) PBMC were treated with influenza H1N1 peptides or tetanus (five subjects each), or the allergens Fel d1 (solid symbols) or Der p1 (open symbols)(three subjects each). The numbers of memory CD4 T cells expressing AR and other cytokines were measured by ICS. The backgrounds (no antigen) have been subtracted. Each symbol represents one individual and the filled bar is the mean of all tested subjects. (E) CD69+ CD4+ T cells (Control_CD69+) were sorted from PBMC incubated in medium alone. CD69+IFNγ+ and CD69+IFNγ- CD4 T cells were sorted from influenza peptide-treated PBMC using the cytokine secretion assay. The mRNA levels of IFNγ and AR were measured by RT-PCR. Results in (A-C) are representative of at least three experiments, (D) represents two experiments using a total of 5 independent subjects, and (E) represents two experiments.

