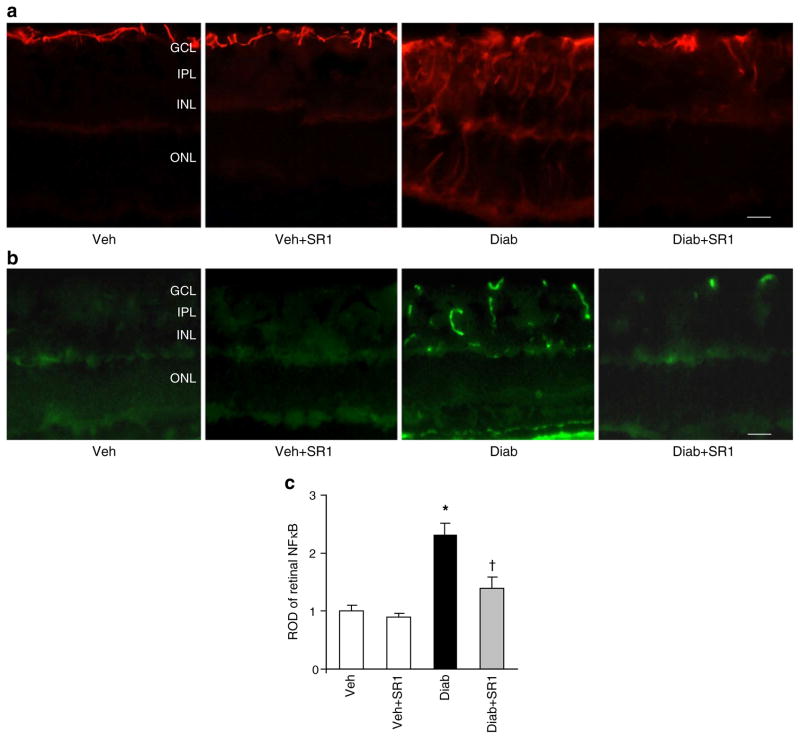
Fig. 4.
CB1 receptor inhibition attenuated diabetes-induced glial activation and NFκB production. a Representative images showing a substantial increase in the intensity of GFAP immunoreactivity in the filaments of Müller cells in diabetes (Diab) vs vehicle (Veh). This increase extended from the nerve fibre layer and inner plexiform layer (IPL) into the outer nuclear layer (ONL) of retina as compared with controls. b Representative images of NFκB in mouse retinal sections showing an approximately 2.5-fold increase in diabetic mice as compared with the controls. NFκB was mainly localised within retinal capillaries (n=6). Magnification (a, b) ×200; scale bars 25 μm. GCL, ganglion cell layer; INL, inner nuclear layer; SR1, SR 141716A. c Statistical analysis of above findings (b); *p<0.05 vs vehicle group; †p<0.05 vs diabetes. ROD, relative optic density

