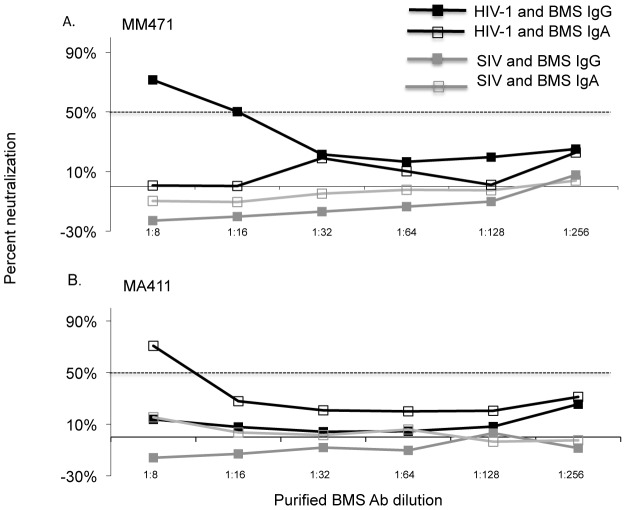
Figure 3. Neutralization potency of IgG and IgA from two mothers against autologous virus.
Representative graphs showing percent neutralization versus BMS purified IgG or IgA dilution. (a) Neutralization by IgG and IgA fractions from subject MM471 and (b) neutralization by IgG and IgA fractions from subject MA411. IgG (filled square) and IgA (open square) responses against pseudovirus generated with autologous HIV-1 env are shown in black lines and against SIVMneCl8 (SIV) are shown in grey lines. The 50% neutralization level is shown with a dotted line. The results are from duplicate testing and are representative of at least two independent experiments.

