
Figure 4. Levels of total and HIV-1 env specific IgG and IgA in unfractionated BMS and plasma.
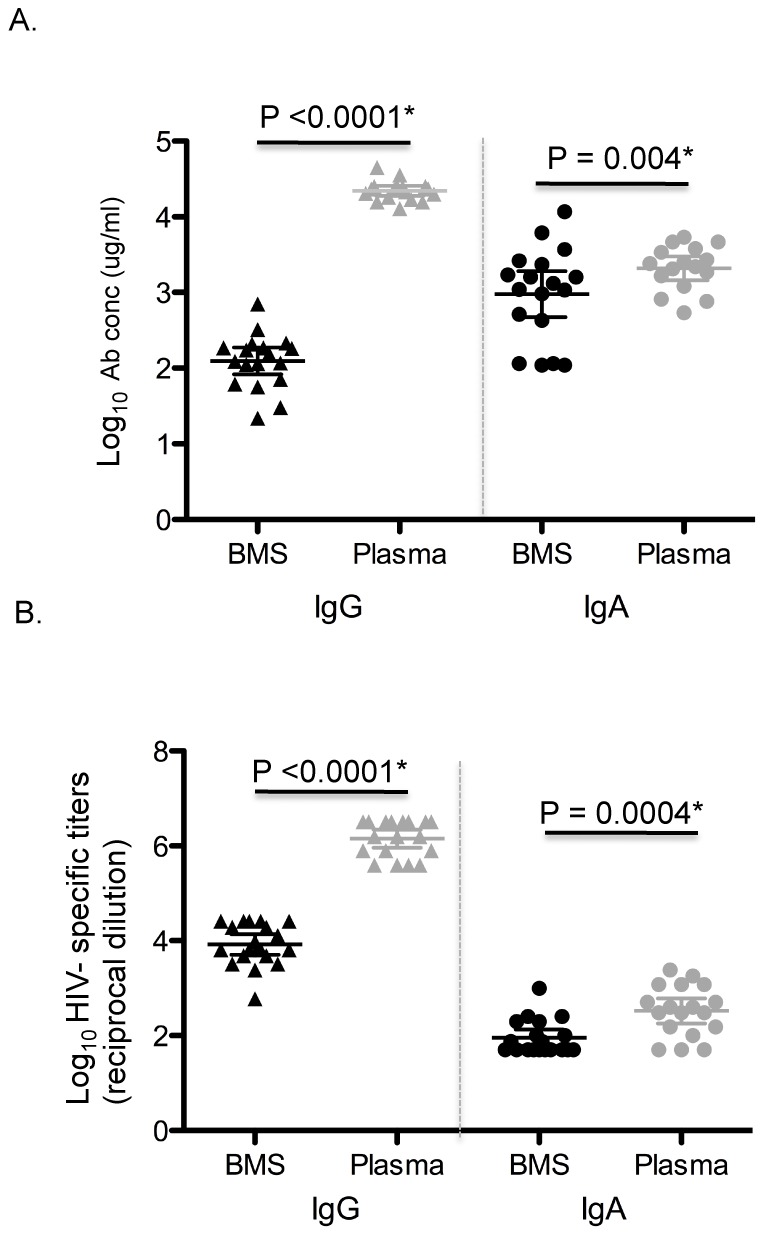
(A)Total IgG and IgA in unfractionated BMS and plasma. The Y-axis shows the log10 Ab conc (ug/ml) and the X-axis shows the sample type and Ab isotype. Black and grey symbols denote BMS and plasma, respectively. Triangles and circles represent IgG and IgA, respectively. (B) Unfractionated BMS and plasma HIV-1 env specific IgG and IgA titers. The Y-axis shows the log10 HIV-1 env specific titers (reciprocal dilution) and the X-axis shows the sample type and Ab isotype. Symbols are as described for A.