
Figure 6. ADCC activity in relation to HIV-1 Env specific IgG titers in BMS.
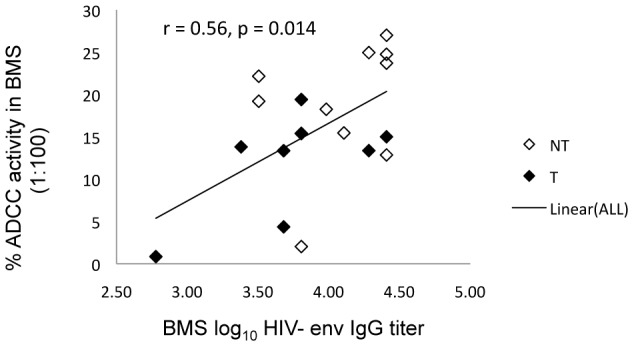
The Y-axis shows % ADCC activity in BMS (1∶100) and the X-axis shows the log10 BM HIV-1 env specific IgG titers. Filled and open symbols represent transmitting and non-transmitting women, respectively. The trend line ‘Linear (ALL)’ is the regression line including both transmitting and non-transmitting women.