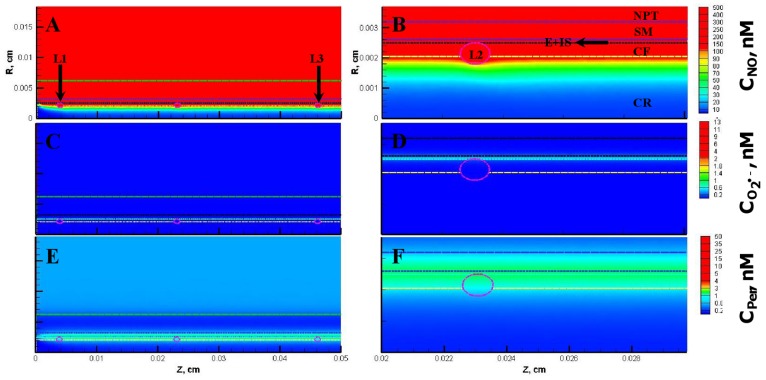
Figure 3. Concentration distribution under normal physiological conditions (Case 1).
Panel A, C and E shows the NO, O2 •− and peroxynitrite (referred as CPer) concentration distribution, respectively across the entire arteriolar geometry. Panel B, D and F shows the NO, O2 •− and peroxynitrite concentration distribution, respectively across a segment of the arteriolar geometry between 200 and 300 µm encompassing the luminal, E, SM and NPT regions. The endothelial and capillary based O2 •− production rates in this case were 5% of their respective NO production rates and the leukocytes were considered inactive.

