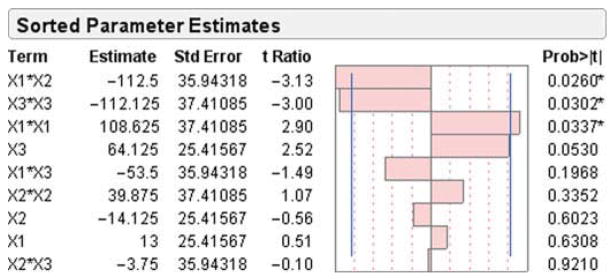
Figure 1.
Pareto chart depicting the standardized effect of formulation variables and their interactions on SLN size; horizontal axis shows the t ratio of the variables. Bars surpassing the two vertical lines indicate values reaching statistical significance (α = 0.05). X1, BSA concentration in the aqueous phase; X2, pH of the aqueous phase; and X3, Softisan 100 concentration in the organic phase.

