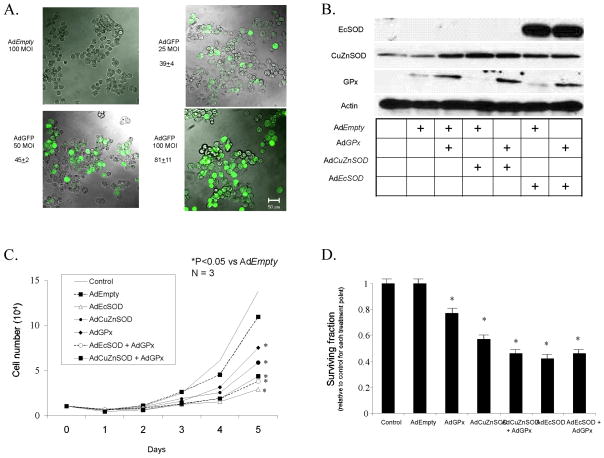
Figure 5. Superoxide is a growth signal in pancreatic cancer.
A. Fluorescence Analysis. MIA PaCa-2 cells were seeded in 8-well chamber slides (Thermo Fisher Scientific, Rochester, NY). Cells were infected with 25, 50 and 100 MOI of AdGFP in serum-free DMEM for 24 h, and then incubated with full media for an additional 24 h. AdEmpty (100 MOI) was used as a control. Cells were fixed with 4% para-formaldehyde for 15 min at room temperature and examined with a fluorescence microscope (Olympus BX-51). For each field, GFP expressing cells and non-expressing cells were counted and the ratio of GFP positive cells was calculated. Fluorescence photomicrographs of MIA PaCa-2 cells infected with increasing viral titer of the AdEmpty or AdGFP constructs demonstrate that there is no fluorescence in the group of cells that received the AdEmpty vector. However, increasing doses of the AdGFP construct increases the percentage of cells that stain positive for GFP.
B. Western analysis of MIA PaCa-2 cells infected with the AdEmpty, AdGPx, AdCuZnSOD and AdEcSOD or combinations. To equalize the viral load of the combined virus in these experiments, the AdEmpty vector was given. For example, the 50 MOI AdGPx was given along with 50 MOI AdEmpty to equal the viral load of the combination of AdGPx (50 MOI) + AdCuZnSOD or AdEcSOD (50 MOI). Lane assignments: 1 = Control; 2 = AdEmpty; 3 = AdEmpty + AdGPx; 4 = AdEmpty + AdCuZnSOD; 5 = AdGPx + AdCuZnSOD; 6 = AdEmpty + AdEcSOD; 7 = AdGPx + AdEcSOD.
C. Cell growth. MIA PaCa-2 cells transduced with 50 MOI AdGPx, 50 MOI AdCuZnSOD (± 50 MOI AdGPx), or 50 MOI AdEcSOD (± 50 MOI AdGPx), demonstrated significant reductions in growth compared to the parental cells and those infected with AdEmpty. No significant changes were seen with AdEmpty transfer compared with parental cells. Mean in vitro cell growth of MIA PaCa-2 cells are shown. Each point represents the mean values, n = 3. * p < 0.001 vs AdEmtpy.
D. Clonogenic survival. MIA PaCa-2 cells transduced with 50 MOI AdCuZnSOD, AdEcSOD, AdGPx, AdCuZnSOD + AdGPx, or AdEcSOD +AdGPx demonstrated reductions in clonogenic survival compared to AdEmpty transduced cells. As in the cell growth experiments, the AdEmpty vector was given to equalize the viral load of the combined virus. Values are mean plating efficiency ± SEM of MIA PaCa-2, n = 3. *p < 0.05 vs AdEmpty.

