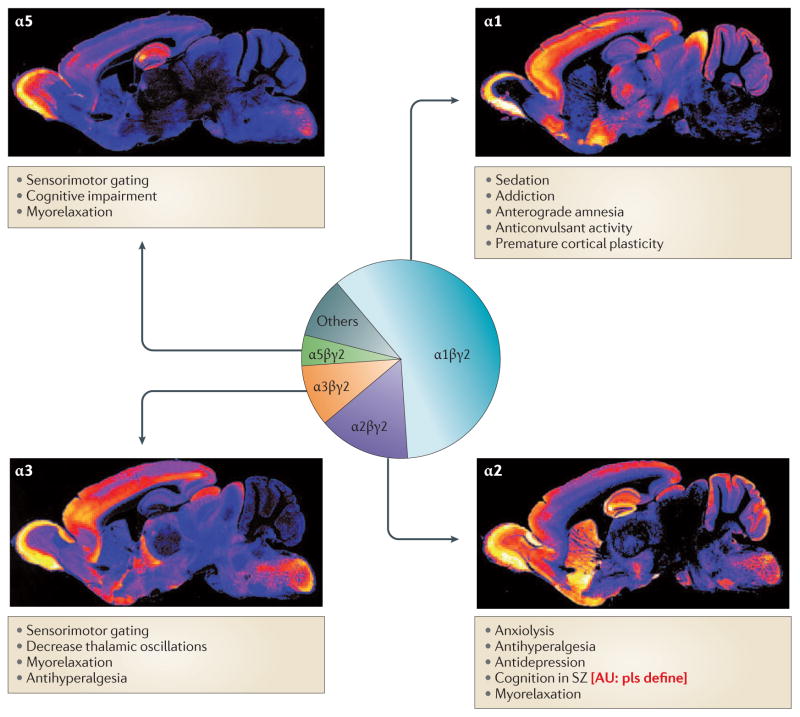
Figure 1. Pharmacological effects and distribution of GABAA receptor α subunits in the mouse brain.
The pie chart represents the approximate abundance of the GABAA receptor subtypes that are known to exist in vivo. α1 is expressed in cortex, thalamus, pallidum and hippocampus. α2 is expressed in hippocampus, cortex, striatum, and nucleus accumbens (not shown). α3 is expressed in the cortex and the reticular nucleus of the thalamus, and α5 in the hippocampus and in deep layers of the cortex. The anti-hyperalgesic actions are mediated by spinal GABAA receptors. Data in references 42, 105–107.
Immunohistochemical pictures are courtesy of Dr. Jean-Marc Fritschy, University of Zurich, and have been published in ref. 88. [CE: waiting to see if we need to apply for permission to use these]

