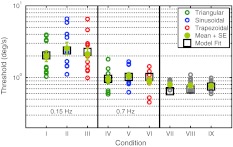
Fig. 5.
Individual threshold data for all participants. The mean is plotted together with the standard error and the best model fit. Note that for conditions VII, VIII, and IX, the actual profile deviated from the commanded motion. The model accurately describes the average data 112 × 70 mm (300 × 300 DPI)

