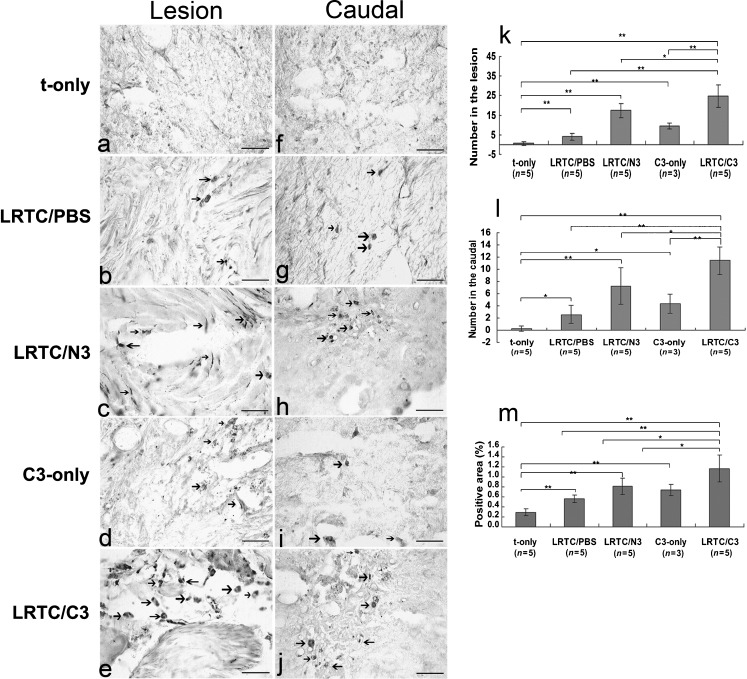
Fig. 2.
Detection and quantification of biotinylated dextran amine (BDA)-labeled corticospinal tract (CST) fibers. (a–j) Photomicrographs of the lumbar region of the spinal cord showing axons regenerating in the CST labeled with BDA in cross-sections. The sections were 400 μm from the border of the lesion and the caudal stump. There were differences in the appearance of the lesion and the caudal portion. Arrows indicate BDA-labeled CST fibers (scale bars 50 μm). The numbers of BDA-labeled fibers in the lesion (k) and the caudal stump (l) and the percentages of positive BDA-labeled fibers per section in the lesioned and caudal segments (m) are shown. There was a statistically significantly larger positive area in the LRTC/C3 group than in the other groups (*p < 0.05, **p < 0.01 as determined by the two-tailed Student's t test). LRTC/PBS linear rat-tail collagen/phosphate-buffered saline animals, LRTC/N3 linear rat-tail collagen/neurotrophin-3 animals, LRTC/C3 linear rat-tail collagen/collagen-binding neurotrophin-3 animals, C3-only collagen-binding neurotrophin-3 only animals, t-only transected-only animals). Adapted from Fan et al. (2010), with permission

