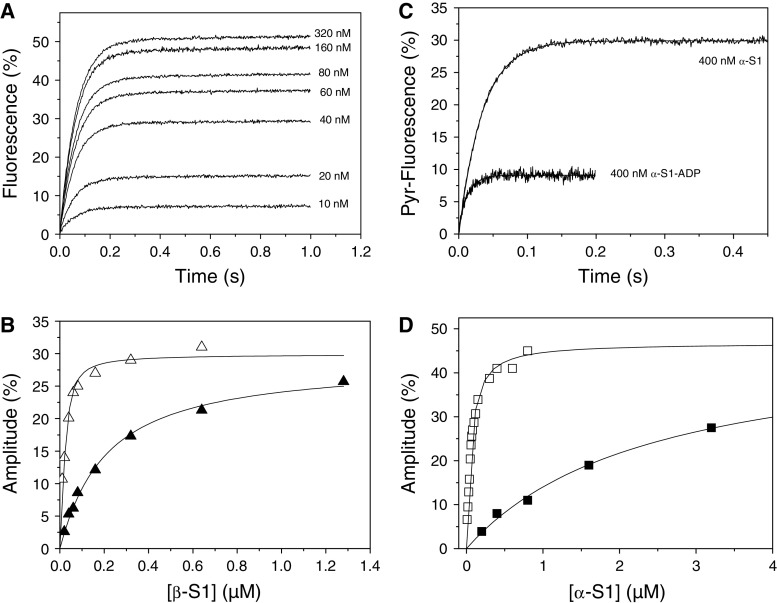
Fig. 5.
Titration of actin with cardiac myosin isoforms. a Fluorescence transients observed when 20 μM ATP was used to dissociate 30 nM actin from increasing concentrations of β-S1. The fluorescence was fitted to a single exponential, the k
obs (= 18 s−1) was constant and the amplitude increased with increasing [S1]. b A plot of the amplitudes in A versus [β-S1] (open triangle) and similar data for β-S1 in the presence of 500 μM ADP (filled triangle). Note that plotted concentrations are before mixing. The result was fitted to the quadratic equation describing the binding isotherm (see “Experimental” section) resulted in a K
A = 8 nM and K
DA = 190 nM for β-S1. c Example traces used for the results in (d): 30 nM actin was incubated with 400 nM α-S1 or 400 nM α-S1·ADP before rapidly mixing with 20 μM ATP or 250 μM ATP. Without ADP the fluorescence transient was fitted to a single exponential with k
obs = 29 s−1 and Amp = 30%. In the presence of ADP the fluorescence transient, fitted to a single exponential, resulted in k
obs = 66 s−1 and Amp = 11%. The large difference in measured fluorescence amplitude is due to the weak affinity of α-S1-ADP for actin. d A similar plot as B for α-S1 (open square) and α- (filled square) in which ADP was 1 mM resulting in K
A = 44 nM and K
DA = 2.4 μM. Plotted concentrations are before mixing. Table 1 gives the average values of 2–3 independent measurements of K
A and K
DA

