Fig. 6.
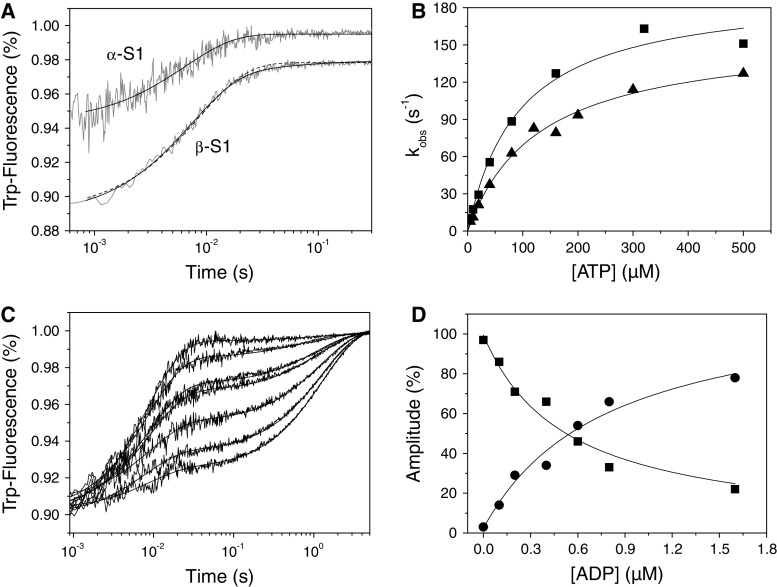
Binding of ATP or ADP to cardiac S1. a Tryptophan fluorescence traces observed upon rapidly mixing 0.2 μM α- or β-S1 with 500 μM ATP. For α-S1 the fluorescence traces were best fit by a single exponential, k obs = 151 s−1 (amp = 5.1%), whereas for β-S1 the fluorescence traces (offset by −0.02) were best fit by a double exponential (solid line), k obs = 124 s−1 (amp = 8.4%) and 19 s−1 (amp = 0.8%). Note that a single exponential fit (dashed line k obs = 117 s−1) is also shown for comparison. b The dependence of k obs on [ATP] yields K 1 k +2 = 2.7 μM−1 s−1 for α-S1 (filled square) and K 1 k +2 = 1.23 μM−1 s−1 for the fast phase of β-S1 (filled triangle). At high ATP-concentrations k obs saturates at 196 s−1 (α-S1) and 158 s−1 (β-S1). The slow phase measured for β-S1 saturates at ~26 s−1. c Tryptophan fluorescence traces observed after incubating 0.2 μM β-S1 with variable [ADP] (0–1.6 μM) before rapidly mixing with 100 μM ATP. The data fit best to a sum of two exponentials with k obs = 112 s−1 (fast phase) and 0.8 s−1 (slow phase). d Dependence of the relative amplitudes of the two exponentials measured in Fig. 6c on ADP concentration (before mixing). The data are fitted to Eqs. 5A and 5B (“Experimental” section) with a K 5 = 0.53 μM (fast phase, filled square) and 0.8 μM (slow phase, filled circle)

