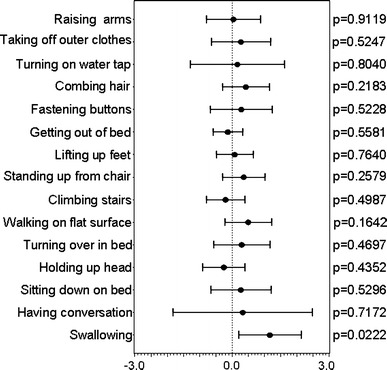
Fig. 8.

Forest plots of before–after differences in ADL scores for the 8-week first period. Black circles and lines, respectively, represent point estimates and 95% confidence intervals of between-group differences (GB-0998 group versus placebo group) in the ADL scores for each activity
