
Figure 1.
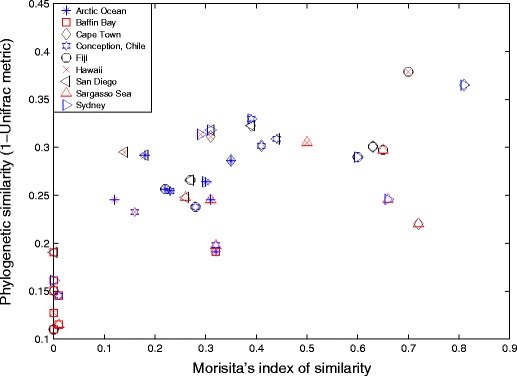
Pairwise comparison of community structure. The Morisita’s index of similarity between communities (x-axis). Converted Unifrac metrics (1 − Unifrac metric) (y-axis). Overlapping points from different communities represents the Morisita’s and Unifrac values for the pairwise comparisons. Similarity is stated in percent where 0 denotes no similarity and 1 denotes identical communities. Correlation coefficient between Morisita’s and Unifrac values, 0.70