
Figure 4.
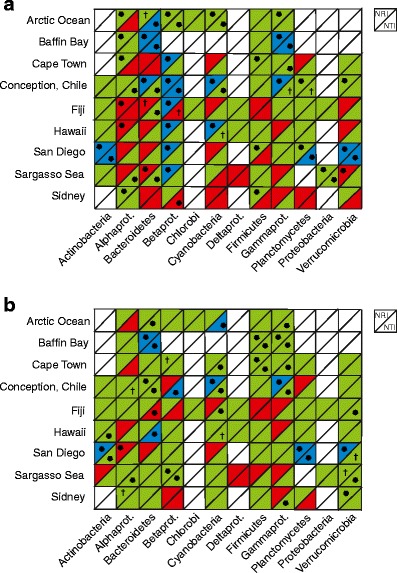
Net relatedness index (NRI) and nearest taxa index (NTI) for all phyla represented in each of the localities. One square per phylum and locality combination, upper left part represents NRI and the lower right part represents NTI. Colour code green denotes positive values (clustered community). Red denotes negative values (overdispersed community). *P < 0.05 and †P < 0.10 denote significant results. Blue denotes positive results, P < 0.05 with Bonferroni correction. Note that after Bonferroni correction, no significant negative results remain. a Analysis made on sequence level, terminal leaves in the phylogenetic tree consists of one single sequence. b Analysis made on OTU level, terminal leaves in phylogenetic tree consist of sequences clustered together based on phylogenetic similarity