
Fig. 1.
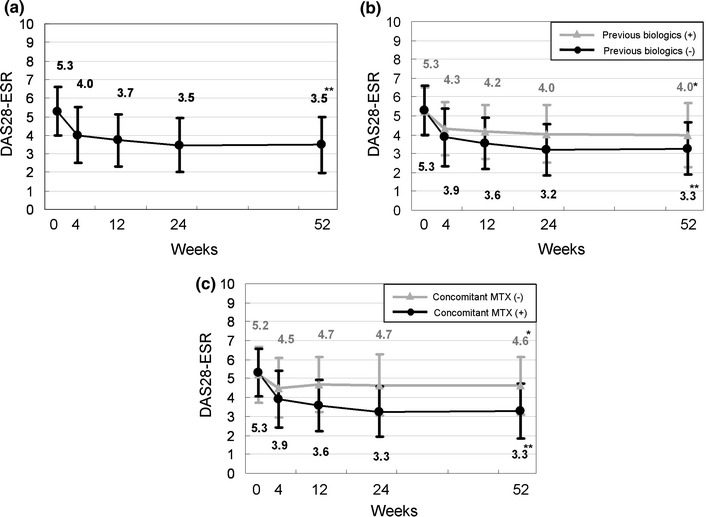
Time course of the disease activity score over 52 weeks following the initiation of adalimumab treatment. Data were analyzed by the last observation carried forward (LOCF) method. Points and bars represent means and standard deviations, respectively. a All patients (n = 167), b previous biologics (+) (n = 49) and (−) (n = 118), c concomitant MTX (+) (n = 143) and (−) (n = 24). *P < 0.05 and **P < 0.0001 versus baseline by the Wilcoxon signed rank test