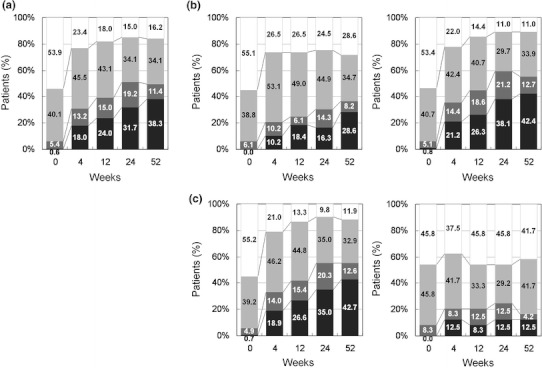
Fig. 2.

Time course of disease activity over 52 weeks following initiation of adalimumab treatment. Data were analyzed by the last observation carried forward (LOCF) method. a All patients (n = 167), b previous biologics (+, left) (n = 49) and (−, right) (n = 118), and c concomitant MTX (+, left) (n = 143) and (−, right) (n = 24). Disease activity was categorized as follows 
