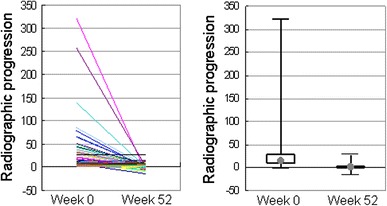
Fig. 5.

Yearly progression of TSS in individual patients at weeks 0 and 52 of adalimumab treatment (n = 87). Radiographic images were available for 71 of 167 patients at weeks 0 and 52. Linear imputation was used for missing data at week 52 for 16 patients who received adalimumab treatment for at least 180 days. Right points and boxes represent the median (13.6 at week 0 and 0.0 at week 52) and the interquartile range (8.3–28.9 at week 0 and −0.9 to 2.0 at week 52), respectively. Median reduction in the yearly radiographic progression was 100%. The reduction was statistically significant by the Wilcoxon signed rank test (P < 0.0001)
