
Fig. 6.
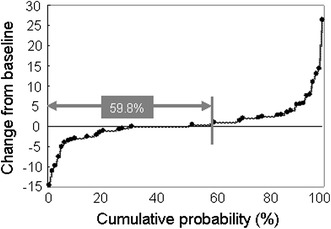
Cumulative probability plot of change in the total modified Sharp score from baseline to week 52 (n = 87). Radiographic images were available for 71 of 167 patients at baseline and week 52. Linear imputation was used for missing data at week 52 for 16 patients who received adalimumab treatment for at least 180 days. In 52 out of the 87 patients (59.8%), the yearly radiographic progression was ≤0.5