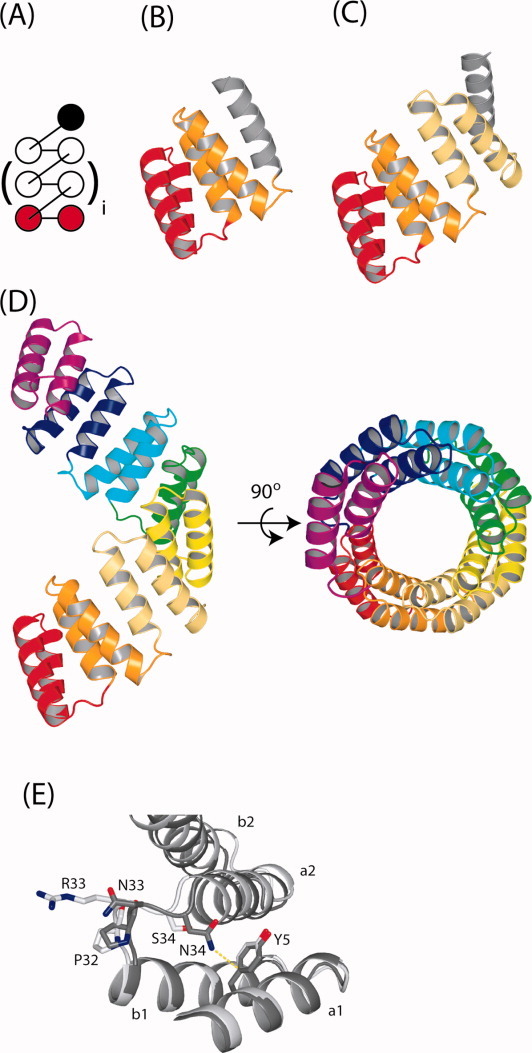
Figure 1.

Topological and ribbon representations of CTPR/CTPRa proteins. (A) Topological map of a native CTPR/CTPRa proteins. The brackets around the central TPR motif indicate that the CTPR/CTPRa proteins can be increased or decreased in size whilst retaining the same topology. For example, for CTPR3, i = 1. (B–D) The crystal structures of CTPR2 (PDB entry: 1NA3), CTPR3 (PDB entry: 1NA0) and CTPRa8 (PDB entry: 2FO7), respectively. In A–D the consecutive repeat units are colored from red (N-terminus) to magenta (C-terminus), with the solvating helix (S) in gray (absent from the crystal structure of CTPRa8). (E) shows detail of the different interactions that the -PNN- of CTPR3 and the -PRS- of the CTPRa8 make in their respective crystal structures. It can be seen that the double mutation (N33R and N34S) changes the interactions present within the interrepeat loops. The N34 sidechain of CTPR3 is optimally aligned for making an amide–pi bond with Y5 of the A-helix from the preceding repeat (a1): the δ-nitrogen of the amide is positioned 3.66 Å from the phenolic ring pi system in the crystal structure of CTPR3.22 N33 is oriented toward solvent. The R33 and S34 sidechains of CTPRa8 have no opportunity to make stabilizing interactions in the crystal form of CTPRa8 and are oriented toward solvent. These structural features result in the -PNN- loop of the CTPR conferring greater stability than the -PRS- loop of the CTPRa protein counterparts. These figures were prepared using PYMOL. [Color figure can be viewed in the online issue, which is available at wileyonlinelibrary.com.]
