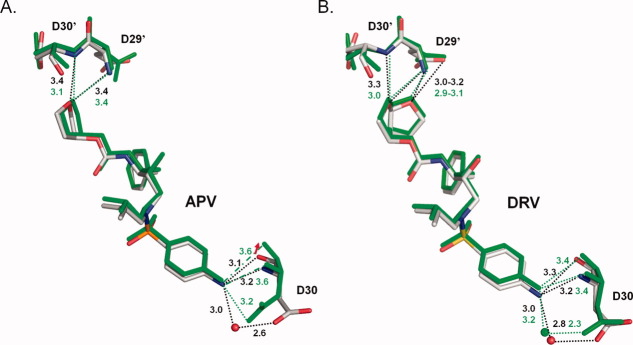
Figure 7.
Hydrogen bond interactions of P2 and P2′ groups in PR1 and PR2 complexes with APV (A) and DRV (B). PR1 complexes are shown in grey and PR2 complexes in green bonds. The inhibitors are shown with Asp29 and 30. Dotted lines indicate hydrogen bonds with distances up to 3.4 Å, and broken lines indicate longer distances. The red arrow indicates the 1.2 Å shift of the carbonyl group of Asp30. [Color figure can be viewed in the online issue, which is available at wileyonlinelibrary.com.]

