
Figure 2.
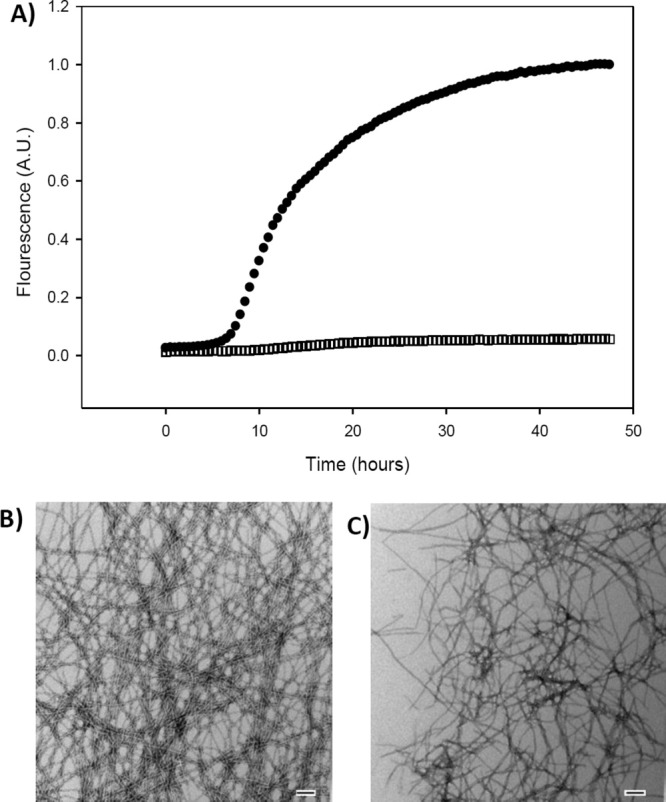
Hydroxyflavones interfere with thioflavin-T-based assays. (A) Thioflavin-T-monitored kinetic experiments. Black circles, IAPP alone. Black open squares, IAPP plus an equimolar amount of Myricetin. (B) TEM image collected at the end of the reaction for the IAPP sample. (C) TEM image collected at the end of the reaction for the 1:1 mixture of IAPP and Myricetin. Scale bars represent 100 nm. Experiments were conducted at 25°C, pH 7.4, 20 mM Tris-HCl, 32 μM IAPP, 0.25% DMSO (v/v).