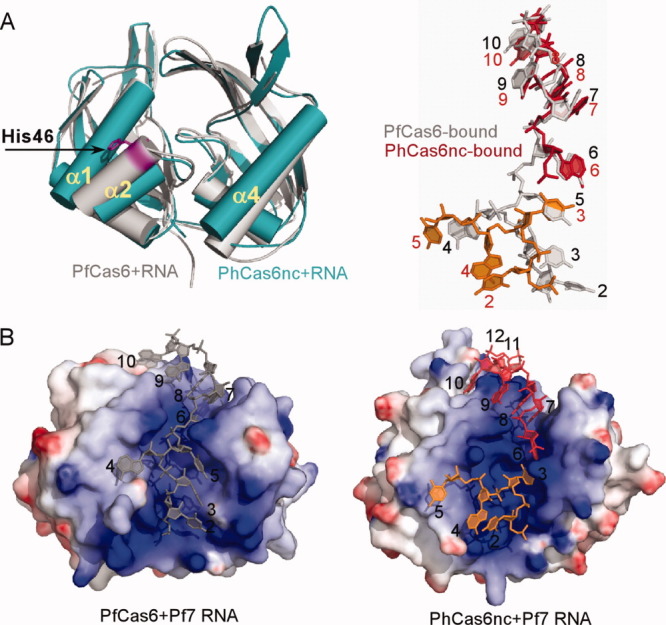
Figure 3.

Structural comparison between the PfCas6–RNA (PDBid: 3PKM) and PhCas6nc–RNA complexes. (A) Superimposed protein structures (PfCas6 in gray and PhCas6nc in teal) and comparison of their bound RNA (PfCas6-bound in gray and PhCas6nc-bound in red and orange). (B) Comparison of the PfCas6-RNA (left) and PhCas6nc-RNA (right) complexes in surface representation. Electrostatic potentials were mapped to protein surfaces and are drawn from −10 kT/e (red) to 10 kT/e (blue). The two bound RNA to the same PhCas6nc subunit are distinguished by red and orange.
