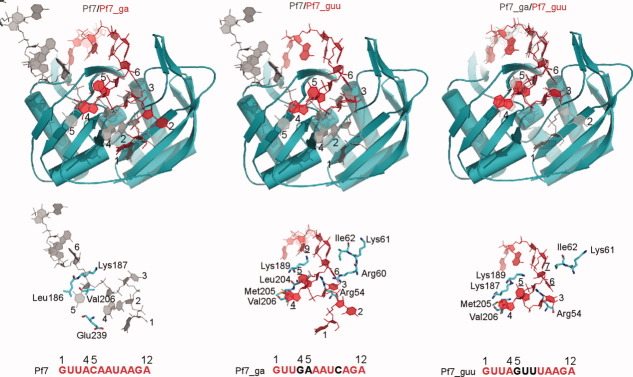
Figure 5.
Comparison of the RNA–protein interaction features of the three complexes. Upper panel, comparison of the bound RNA. For each compared pairs, the two protein molecules are superimposed and RNA molecules follow. The RNA molecules are distinguished by grey and red colors and are identified by the labels of the corresponding colors. Lower panel, comparison of protein residues (cyan–blue–red stick models) that interact with the three RNA (grey or red). Each RNA is identified by the sequence shown directly below and the nucleotides different from Pf7 RNA are identified by underlined numbers.

