Figure 1.
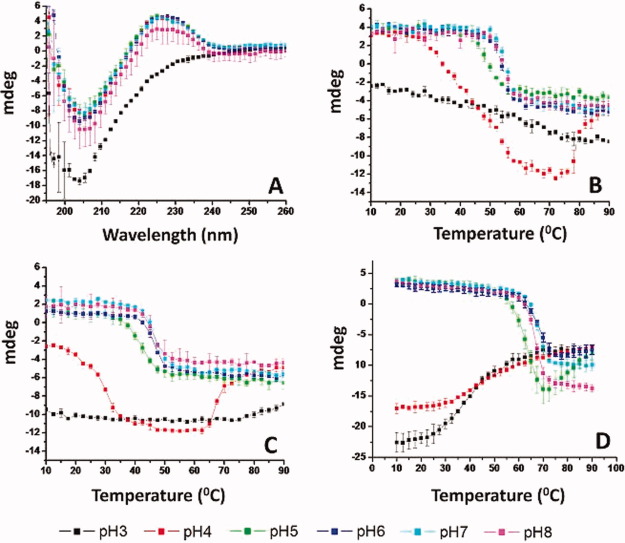
Far UV CD analysis of WT FGF-1 and a representative FGF-1 mutant. (A) CD spectra of the K12V/C117V/P134V mutant measured at 10°C at different pH values. (B–D) CD signal at 228 nm as measured as a function of temperature at indicated pH values for (B) K12V/C117V/P134V, (C) WT FGF-1, and (D) WT FGF-1 with heparin. Data points are an average of two independent analyses. Complete CD data sets for the other nine FGF-1 mutants are provided in Supporting Information section. See Table I for a further description of each mutant including K12V/C117V/P134V (H in Table I). [Color figure can be viewed in the online issue, which is available at wileyonlinelibrary.com.]

