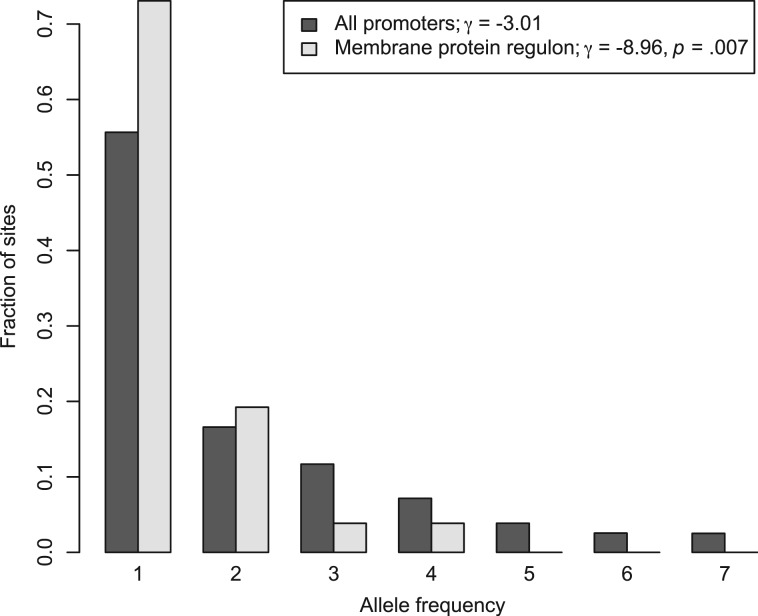
Fig. 2.
Increased strength of purifying selection in the membrane protein regulon in Saccharomyces paradoxus. Each shade of gray represents analysis of single-nucleotide polymorphisms in one set of promoter sequences from European strains of S. paradoxus (Liti et al. 2009). Each set of bars represents a histogram of frequencies of minor alleles. All promoters, analysis of promoter regions from all genes in the genome. Membrane protein regulon, analysis of promoter regions from the membrane protein gene group (fig. 1 and supplementary table 1, Supplementary Material online). γ, population-scaled selection coefficient inferred from the allele frequency spectrum from the indicated set of promoters. P, significance of the distinction between the genomic selection coefficient and the coefficient inferred from the membrane protein group, according to likelihood ratio testing. Results are based on a data set of resampled alleles to ensure fully informative sequence data at each site (see Materials and Methods).

