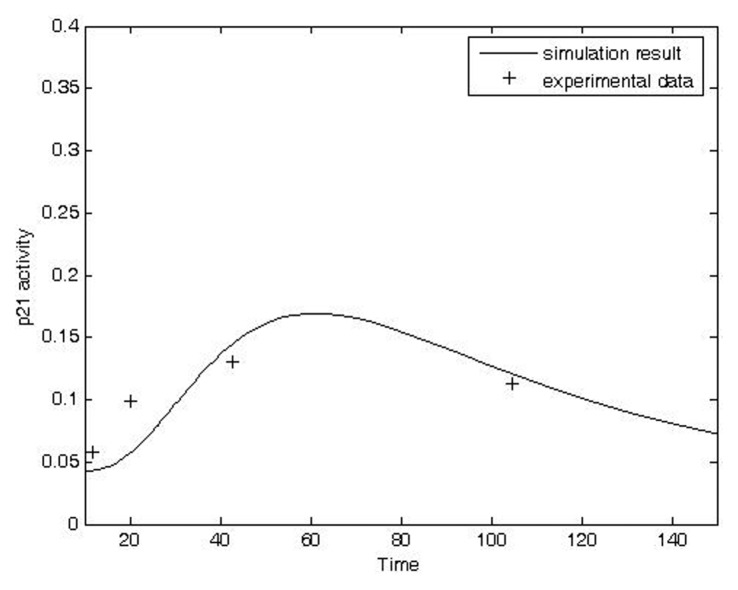
FIGURE 4.
Comparison of model prediction and transformed experimental data time course of p21 activity in carbon ion-irradiated confluent fibroblasts. Original data from Fournier et al. (2004). (Simulation condition: IRR = 0.5, t = 10 unit; Experimental condition: dose: 0.5 Gy; exposure duration: 0, 1.5, 3, 6, 12, 24 hours after radiation, respectively).

