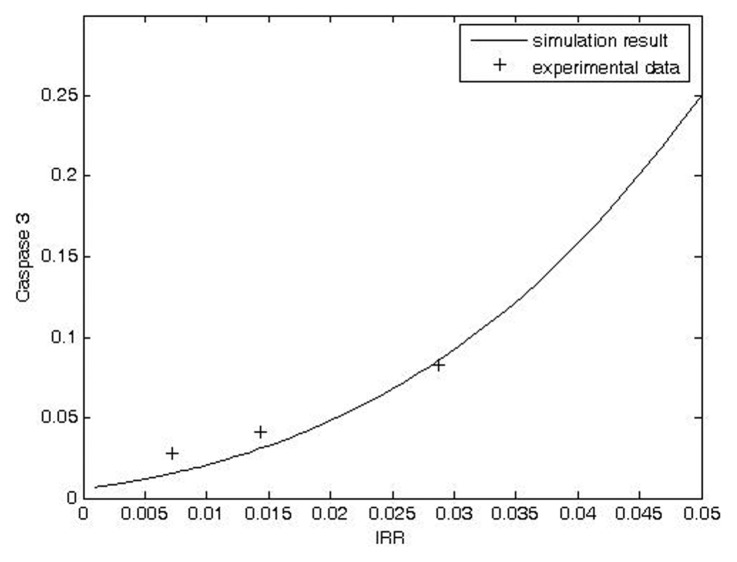
FIGURE 5.
Comparison of model prediction and transformed experimental data for dose response curve of caspase 3 activity versus 137Cs-irradiated lymphoblastoid cells. Original data from Fernet et al. (2003) (Experimental condition: dose: 5, 10 and 20 Gy).

