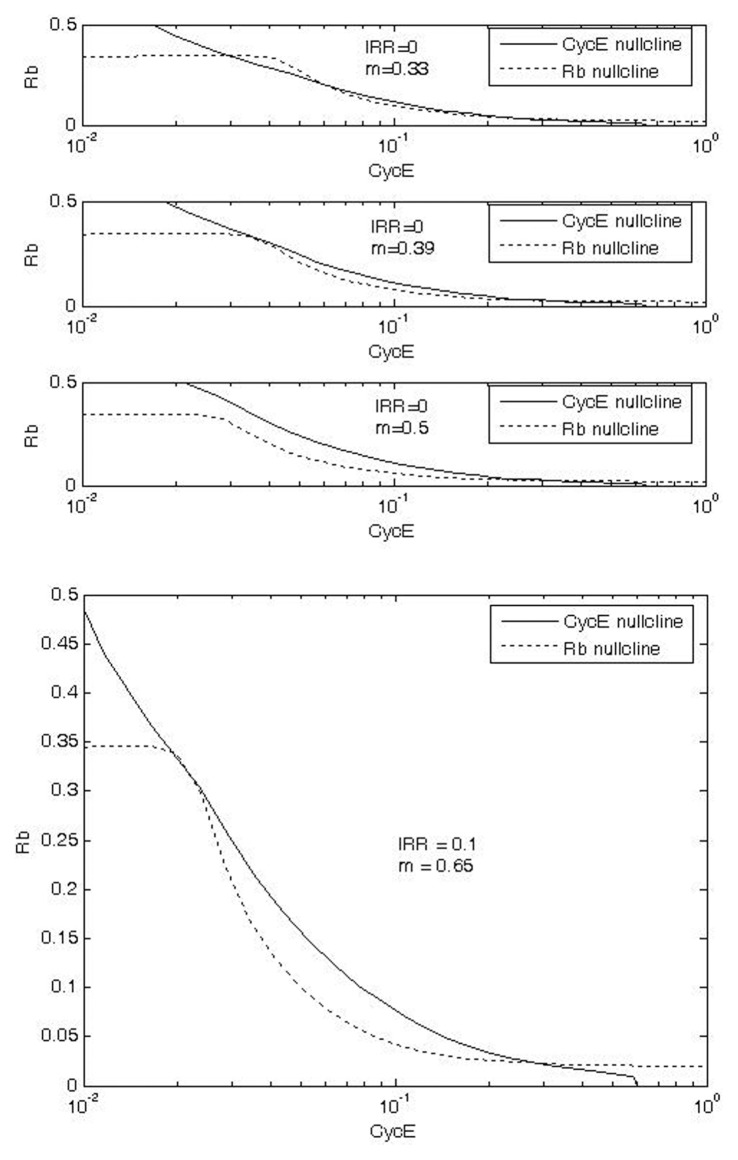
FIGURE 6.
Phase plane plots of CycE and Rb nullclines in G1/S checkpoint without (a) and with (b) exposure to IR. The three panels for (a) show that, as cell mass (m) increases (0.33 ‡ 0.39 ‡ 0.5), the Rb nullcline moves to the left relative to the CycE nullcline and the stable steady state at low CycE disappears, triggering the switch to S phase. Under exposure to IR, the switch is activated only at higher m, thus allowing extra time for DNA repair.

