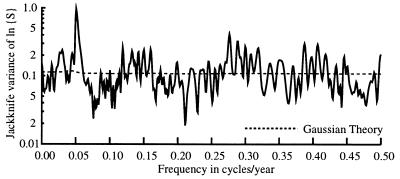
Figure 2.
The estimated jackknife variance of the natural log of the spectrum of solar irradiance changes. The dashed curve is the expected value and varies slowly as the adaptive weighting process changes the degrees-of-freedom of the spectrum estimate. Note the high peak near the 22-year Hale cycle and the low variance near the 11-year cycle, 0.09 cycle/year.

