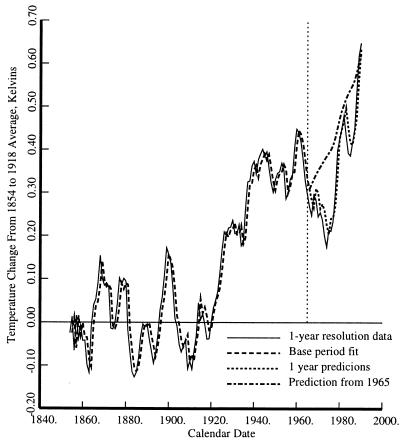
Figure 6.
The Northern Hemisphere temperature data, solid line, and fits. The model coefficients were determined using data before 1965 with the fit shown by the dashed line. After 1965 the fit includes CL(t), L(t) and the previous year’s temperature. The smoother line, short dashes, shows the prediction starting with the 1965 temperature using only CL(t) and L(t).

