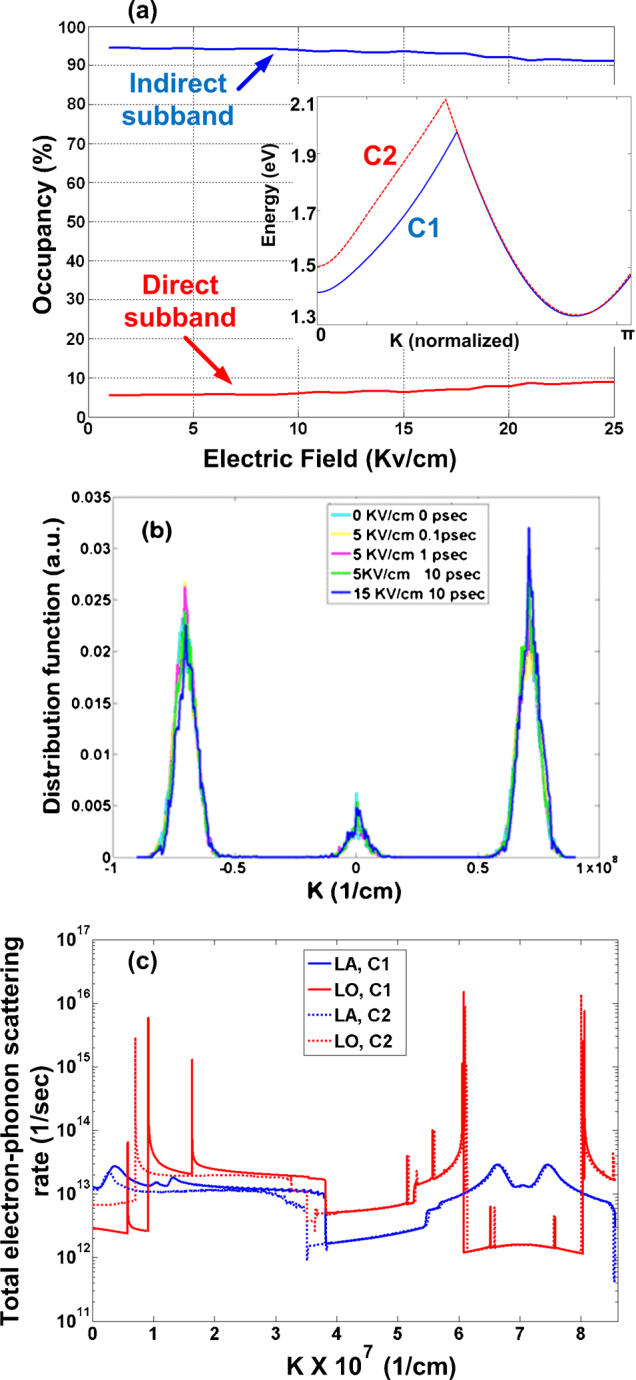
Figure 5. Monte Carlo evolution of sub bands occupancy and electron-phonon scattering rates.

(a) Occupancy of indirect and direct sub bands vs. electric field for a 3.1 nm [110] SiNW at −5% strain (indirect bandgap). Inset shows the positive half of the BZ (i.e. k spans [0,π]) with two conduction sub bands used in the EMC simulation. (b) Time evolution of the electron distribution function under different electric fields. (c) The total LA and LO electron-phonon scattering rates. In the legend, C1 and C2 show the initial sub band from which the electron is scattered by emission/absorption of LA and LO phonons.
