FIGURE 2.
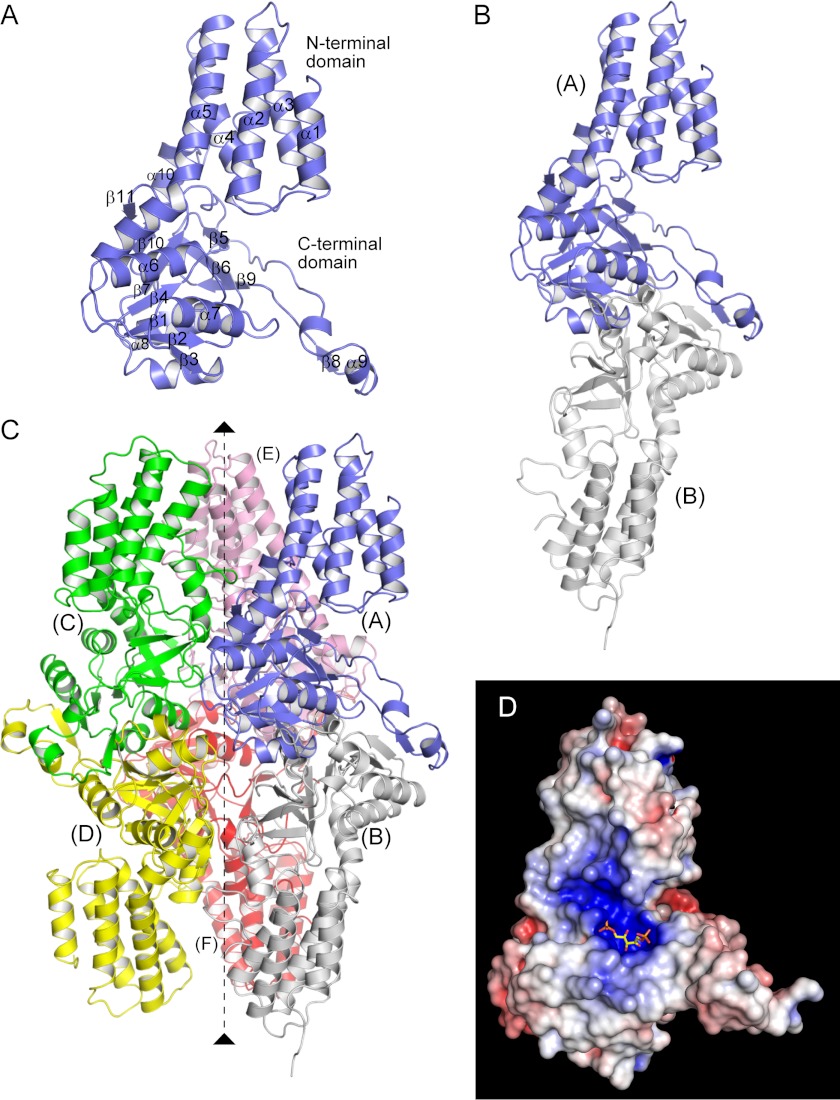
Crystal structure of Tk-R15Pi. Shown are the monomer (A), dimer (subunits A and B) (B), and hexamer (subunits A–F) (C) structures of the nonliganded enzyme. The non-crystallographic 3-fold axis is shown by a broken line in C. D, electrostatic potential map of the monomer in the Tk-R15Pi·RuBP complex. The map was drawn on the solvent-accessible molecular surface (red, −10 kT (the Boltzmann constant multipied by absolute temperature) e−1; blue, 10 kT e−1) calculated with a probe radius of 1.4 Å using the program APBS (39). The molecular orientation is the same as in A.

