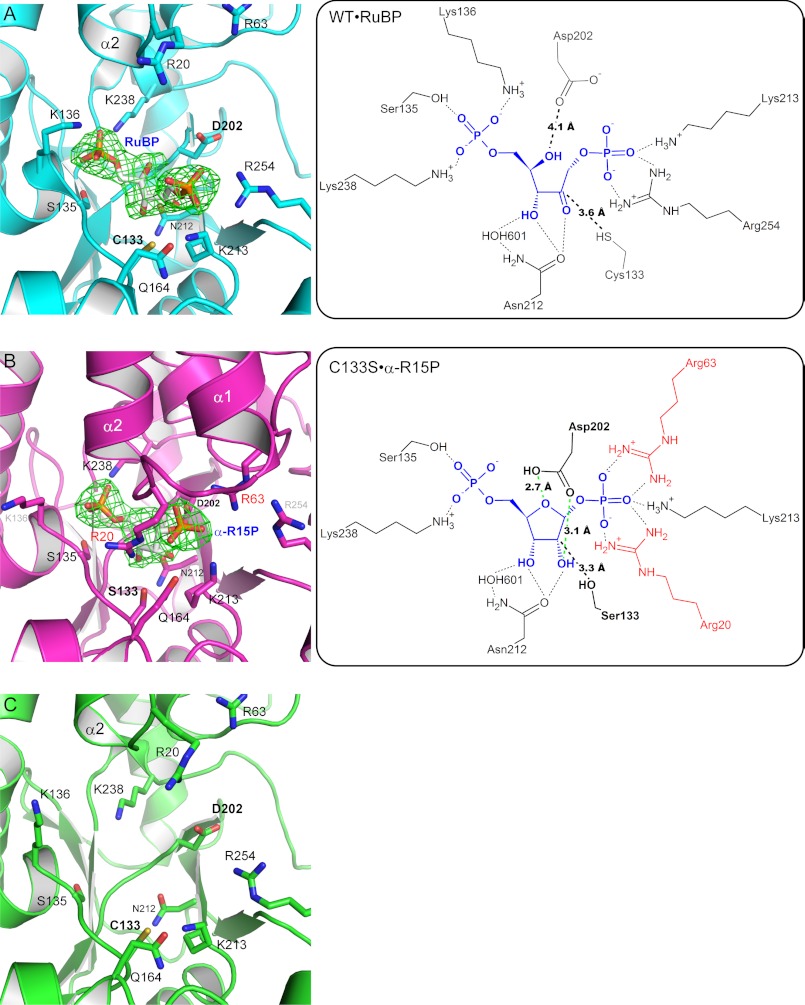
FIGURE 5.
Close-up views of the active sites of WT·RuBP (A), C133S·α-R15P (B), and WT (unliganded) (C). Green meshes indicate the Fo − Fc omit maps for RuBP or α-R15P contoured at 4.0σ. Schematic representations of the active site in WT·RuBP and C133S·α-R15P are shown in the right panels. Green broken lines represent the hydrogen bonds between Asp202 and α-R15P (B, right).

