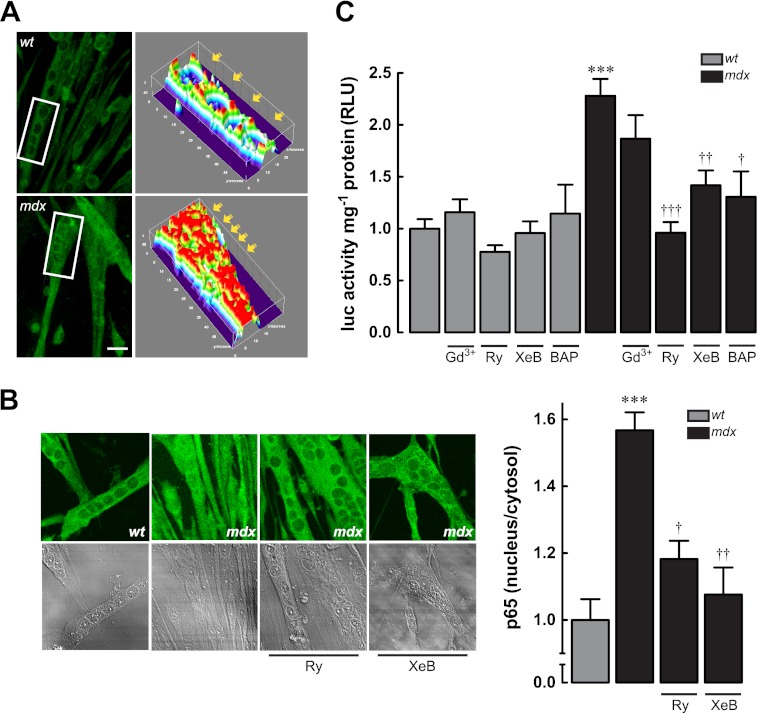
FIGURE 4.
NF-κB activity in WT and mdx myotubes. A, left panel, representative z-stack immunofluorescence images obtained by confocal microscopy; right panel, three-dimensional reconstructions made with the ImageJ (National Institutes of Health) plugin Interactive 3D Surface Plot. B, effect of SR Ca2+ release inhibition in p65 subcellular distribution. C, NF-κB luciferase reporter activity in WT and mdx myotubes treated with Ca2+ inhibitors. Myotubes were incubated for 6 h and then lysed for luciferase activity determination. Data are expressed as mean ± S.E. from at least three different determinations, ***, p < 0.001 versus WT basal value, †††, p < 0.001; ††, p < 0.01 and †, p < 0.05 versus mdx basal value.

