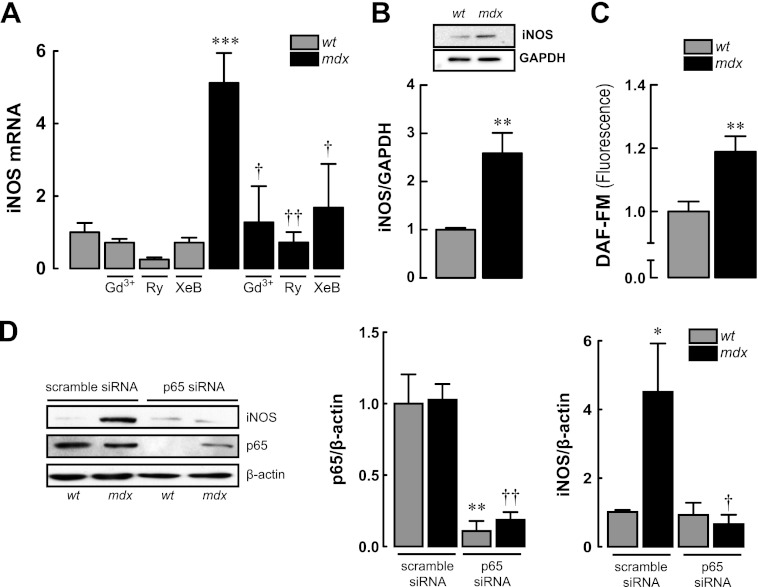
FIGURE 5.
iNOS expression in WT and mdx myotubes. A, iNOS mRNA levels assessed by real time PCR showing effects of [Ca2+]rest reduction on iNOS mRNA expression. B, iNOS protein expression determined by Western blot. C, levels of nitric oxide (NO) was determined with DAF-FM fluorescence probe with confocal microscopy. D, effects of p65 knockdown by siRNA in the levels of p65 and iNOS proteins expression determined by Western blot. Myoblasts were transfected and then differentiated to myotubes for 48 h before the protein determination. Data are expressed as means ± S.E. from at least three different determinations. ***, p < 0.001; **, p < 0.01 and *, p < 0.05 versus WT basal value, ††, p < 0.01 and †, p < 0.05 versus mdx basal value.

